
In the last article, we connected Excel to our SSAS Cube, and did some pivot table analysis. Now we are going to increase our analysis ability by adding a date dimension so the data can be further broken down.
There are going to be a ton of screenshots for this lesson, so lets go. Open up your cube in SSDT or Visual studio and right click on Dimensions in the solution explorer and select New Dimension.

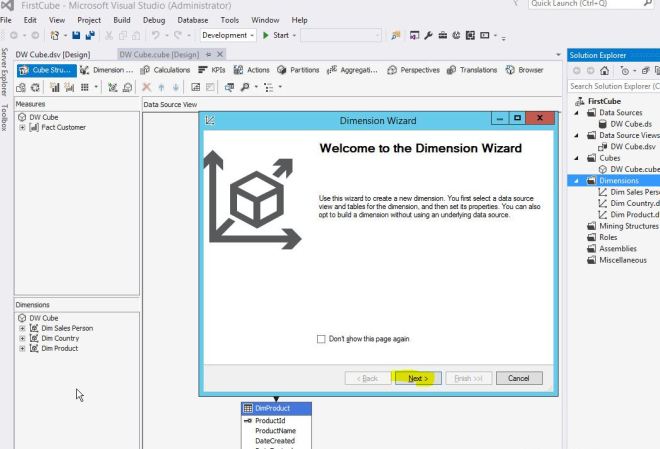
This opens up the Dimension Wizard, click next.
We want to create a Time Table in the data source, which means to create a table full of dates and other date information in the database, so select it from the list and press next.

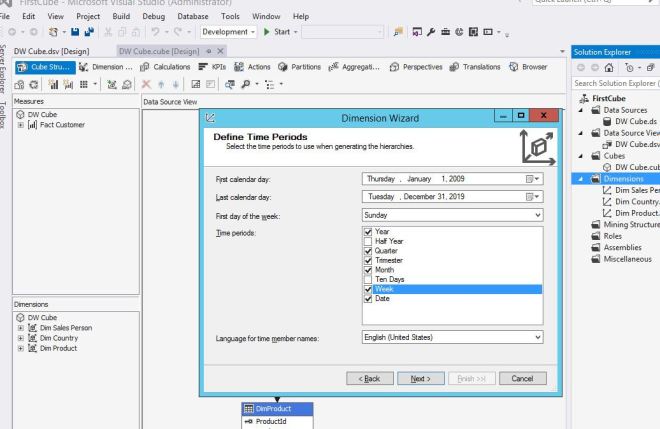
Next you need to pick what dates you want to populate your table with. In a production environment, you would use a start date of your first data record and then go out 20-30 years from the current date. You want to only create this table once, so you may as well fill it up now since it takes up very little room. Twenty years of date information is only 7300 or so rows. You can also pick what sort of columns will be created in your table, I have selected the ones below.
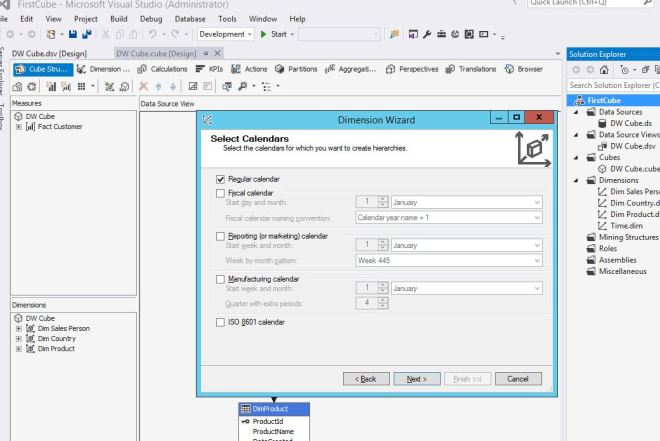
I am picking a Regular calendar, but there are other options you may choose depending on your industry.
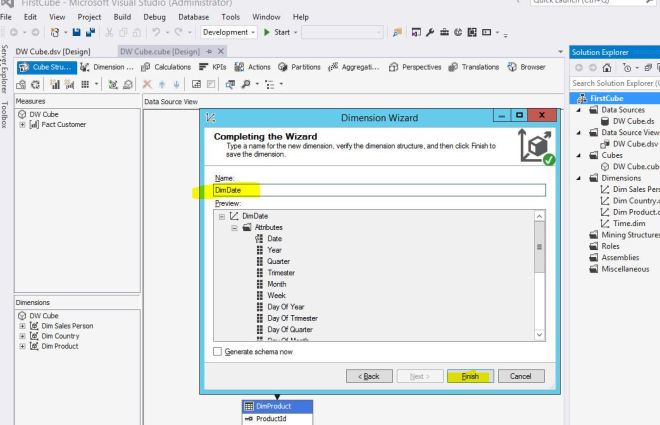
That takes us to the final screen of the wizard, we will name our new dimension table as DimDate. Press finish to complete.
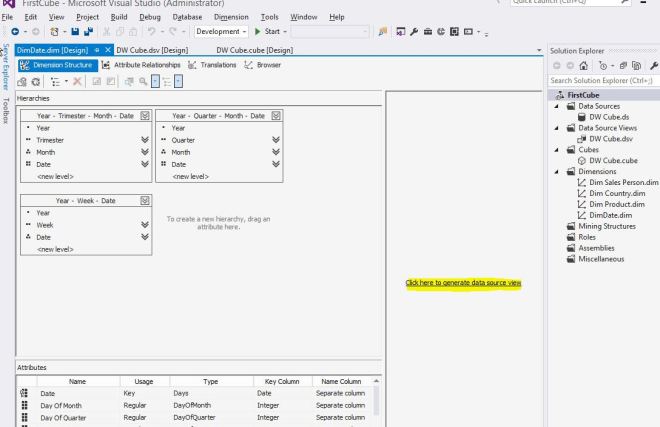
That takes us to this screen, now you want to actually create the table in your database so click the link in yellow below: “Click here to generate data source view.”
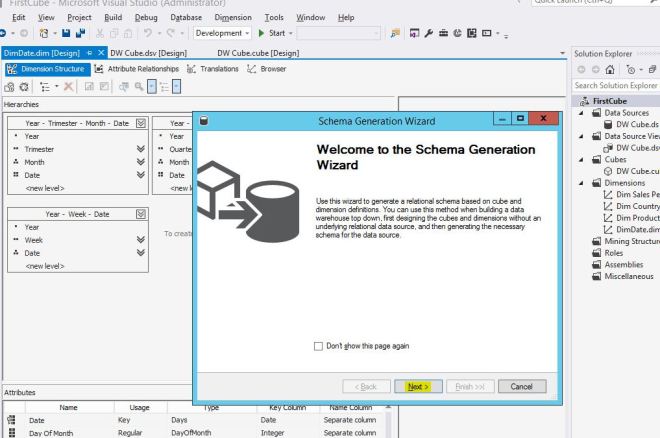
That will bring up the following wizard…press next to start.
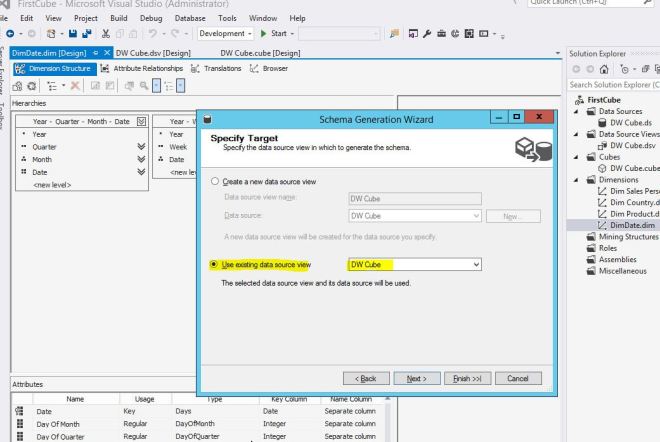
We want to use an existing data source, so I am choosing DW Cube.
We will accept the defaults for indexes and primary keys.
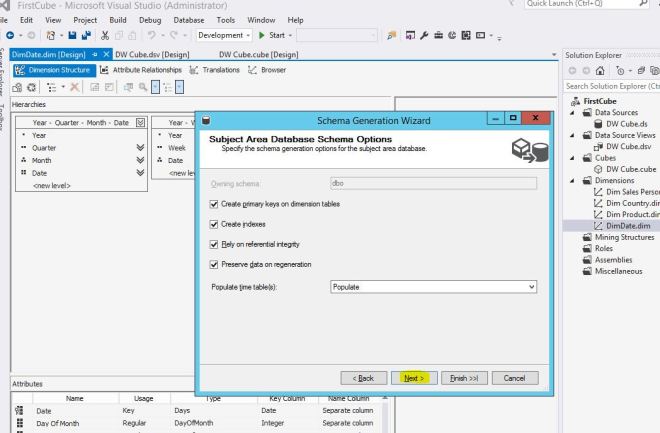
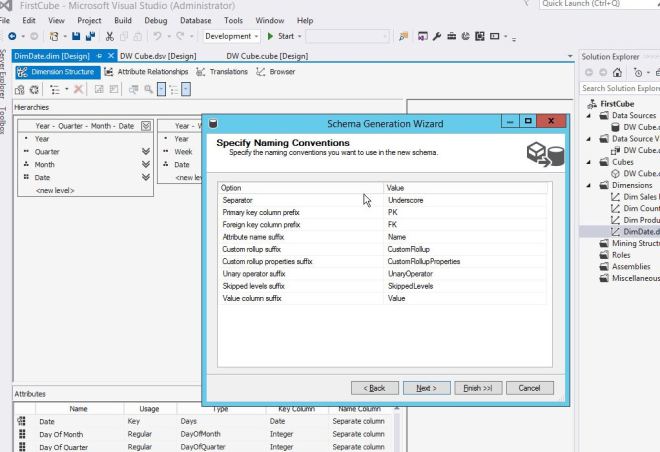
You may change some options for naming conventions, but I will accept the default and press next.
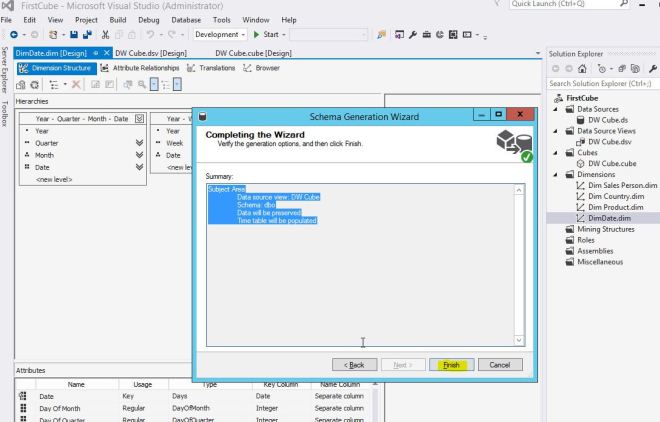
For the final screen of the wizard, press finish.
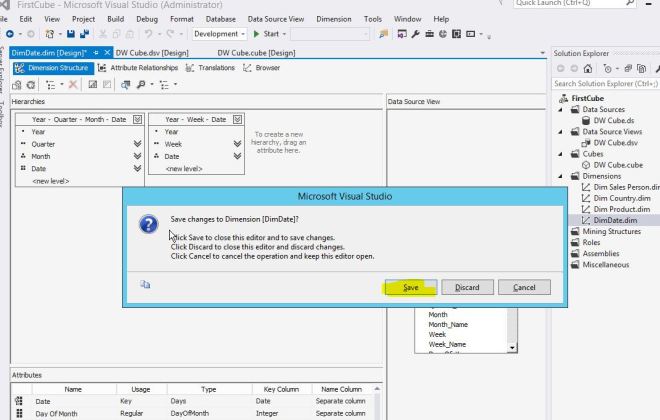
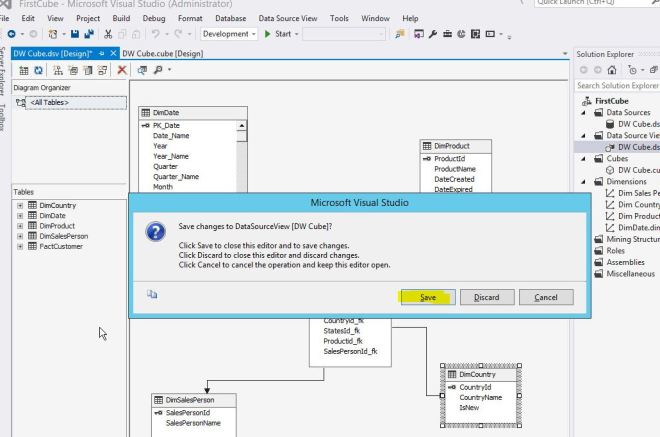
This will take us to the dimension screen, so if we close the tab it asks us if we want to save, we will choose save.
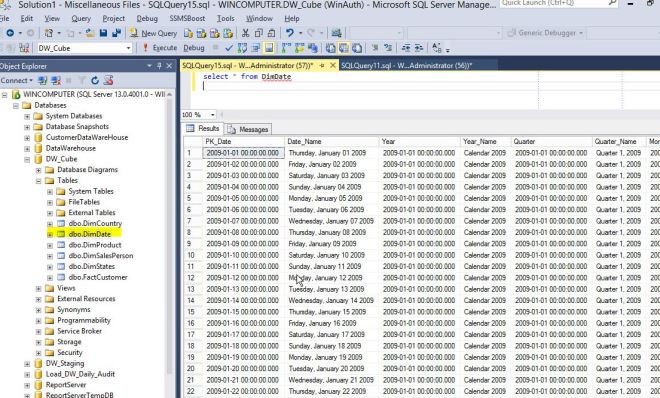
That will create a table in our database called DimDate and here is a quick listing of some of the fields in the database.
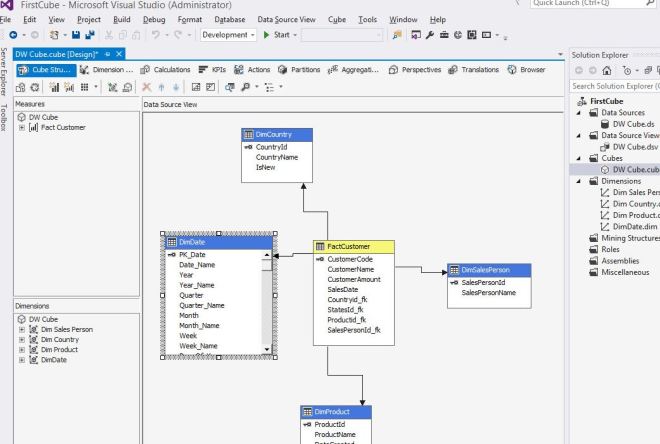
Under Data Source View in Solution Explorer, double click to open up our cube design like below. We need to link the DimDate table to the FactCustomer table. You do that be clicking on Saledate in FactCustomer and then drag to the PK_Date field in the DimDate table.
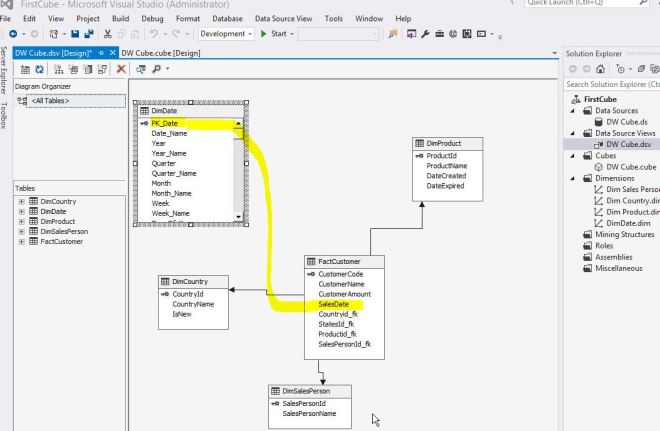
Here is what it looks like when you are done.
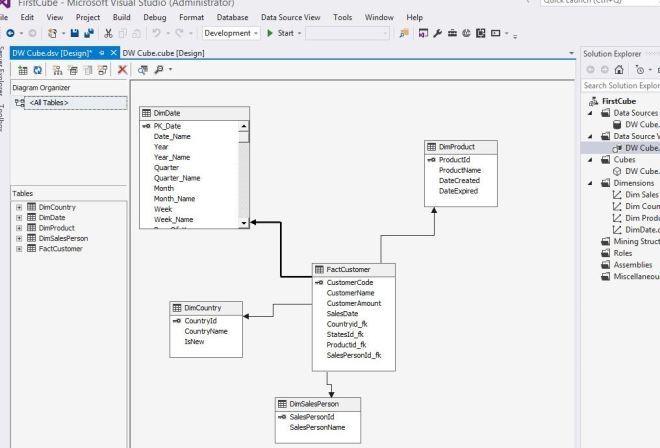
Now close this tab and you will be prompted and you should save again.
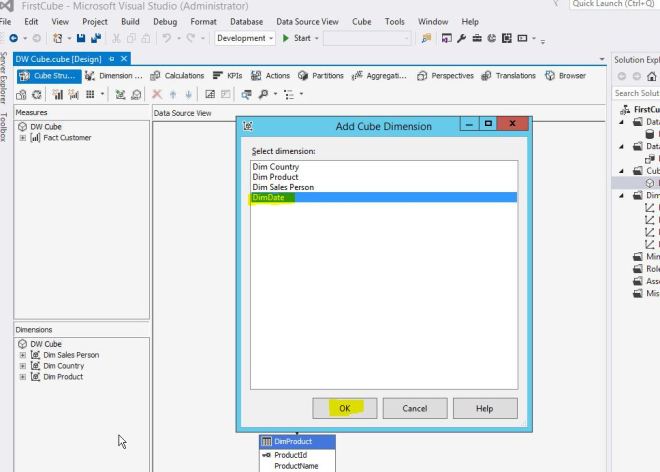
Now on the main screen, you will notice that the DimDate table does not show up. We will add it by clicking on DW_Cube in the dimension box at the bottom left and “Add Cube Dimension”.
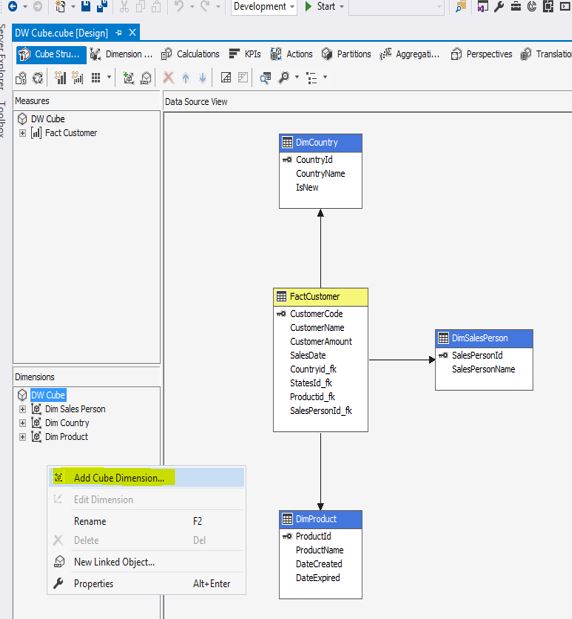
It will ask us what dimension to add, so choose DimDate and press ok.
Now it is added on the main screen and should look like below.
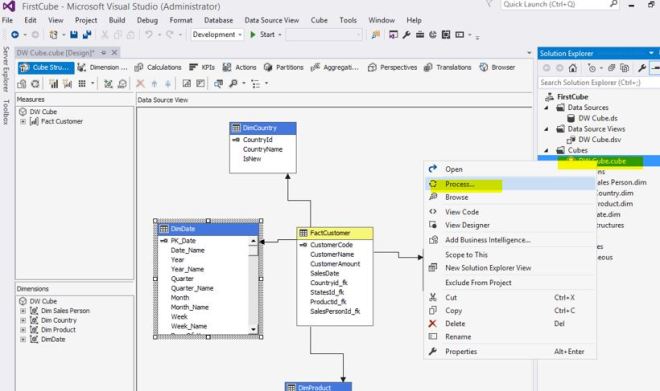
Almost done…..now we need to re-process our cube to add the new dimension so we can use it. Under Solution Explorer, right click our cube and select process. You will remember these steps from last weeks article.
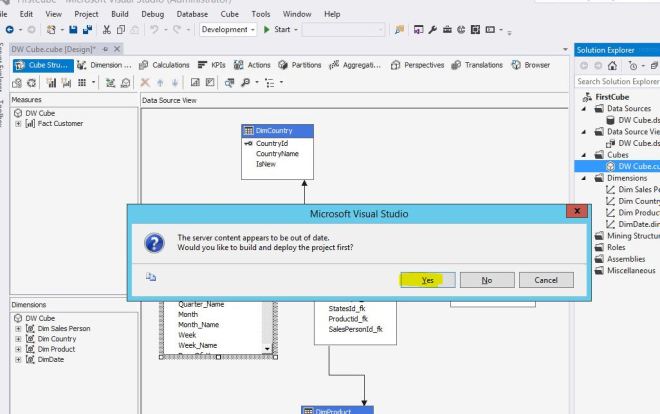
It will tell us our content seems out of date, so select yes to build and deploy.
Select yes again because we want to update our SSAS database to incorporate our new changes.

Type in your password and press ok.

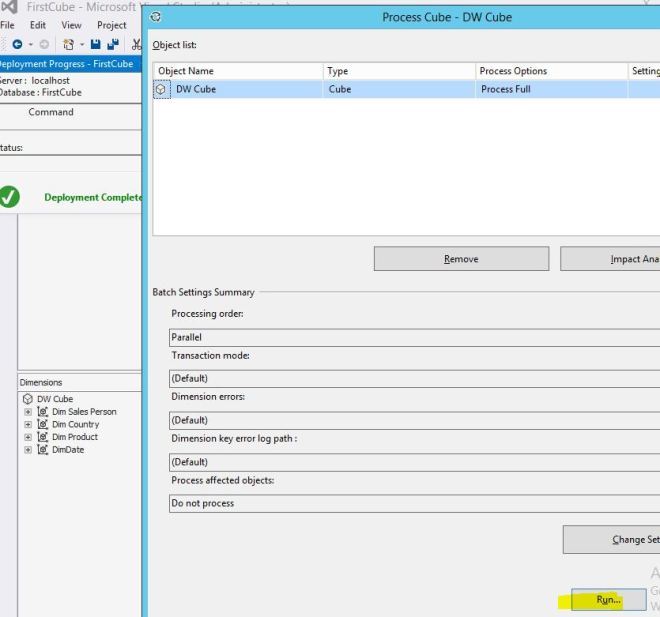
This will bring up the process cube options page, press run to finally update the cube.
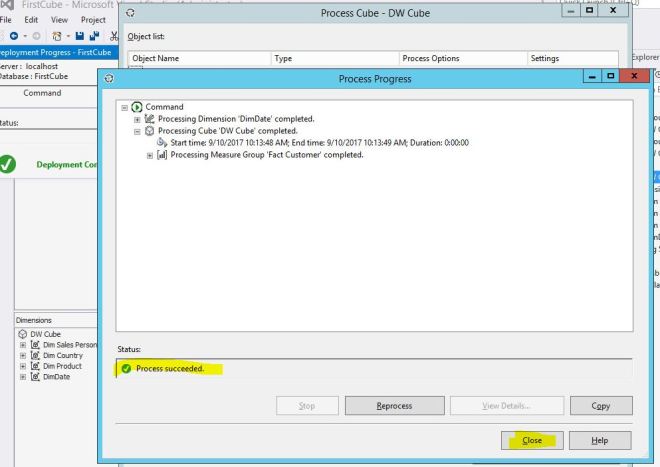
If all goes well, you will get process succeeded message like below, press close.
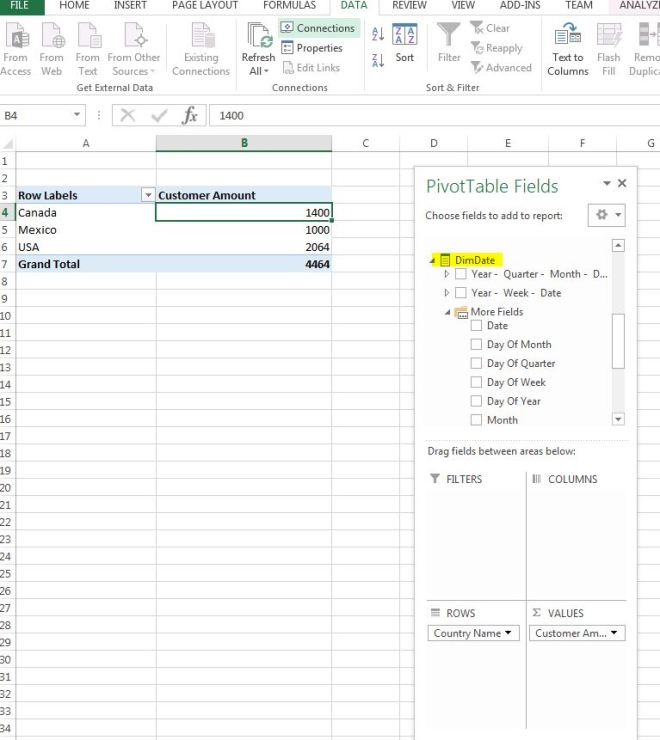
Now we open up our Excel file from last week and refresh our data source we will see a new field in the pivot table fields called DimDate.
Time to have some fun.
If we select Year, that breaks down the sales by year and we see 2014 was our best year.
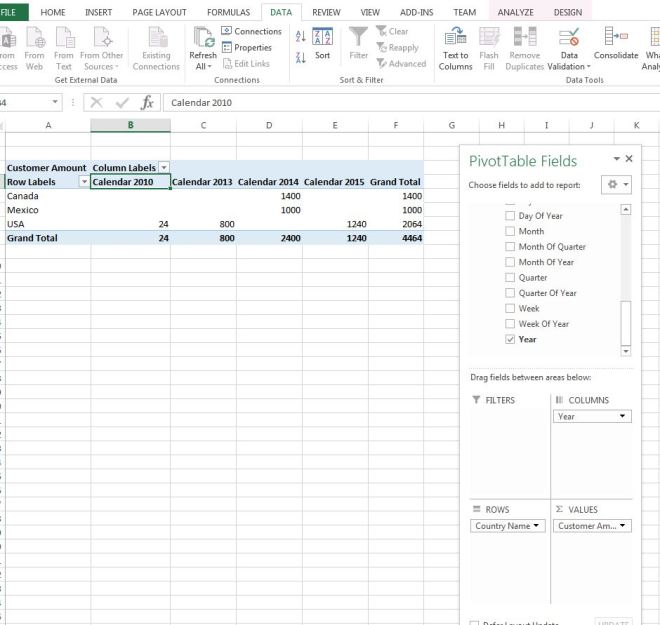
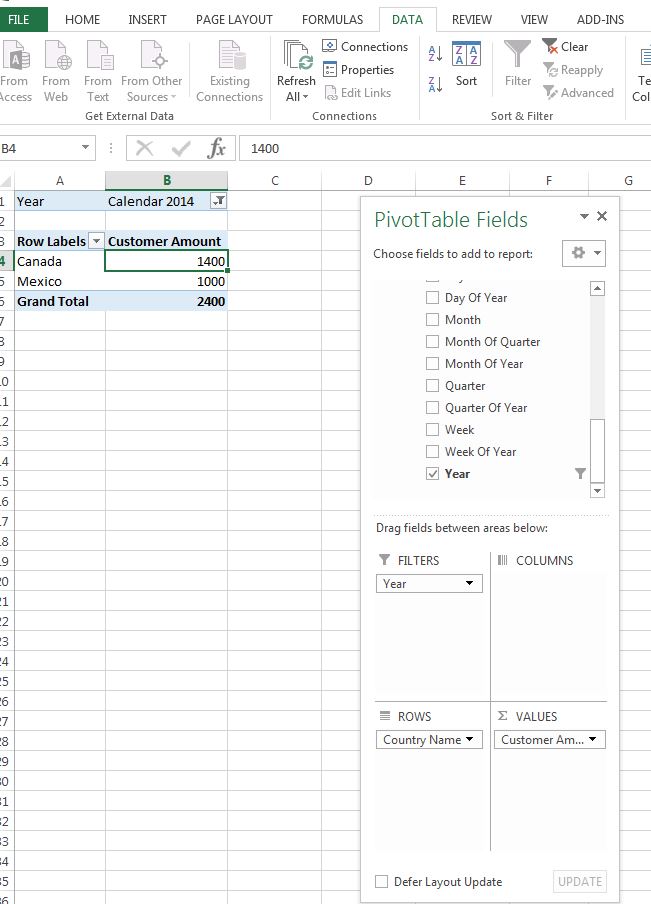
You can also put one of the date fields in the filter section. Using the drop down and picking Calendar 2014, we see the two countries that had sales for only that year.
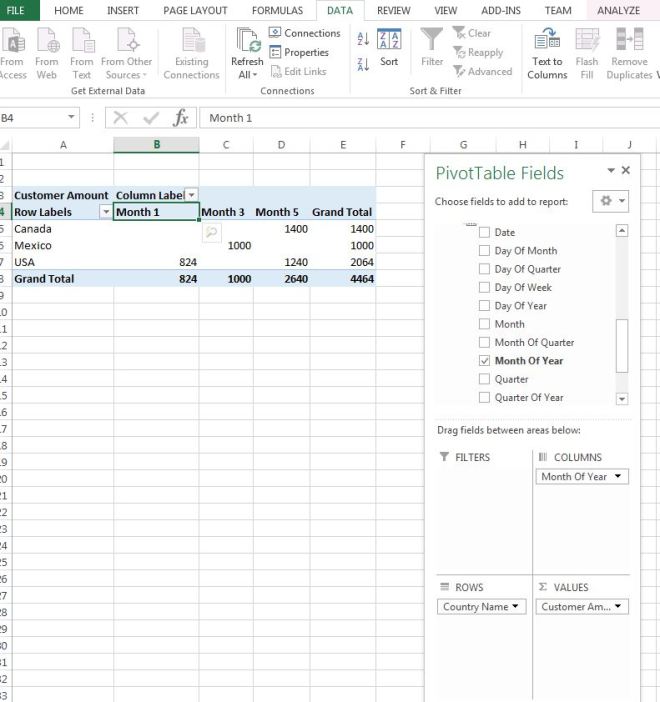
Now we can see what month had the most sales by selecting Month of Year. It looks like month 5 (May) has the most sales. We could also add year to see what year and month were most popular.
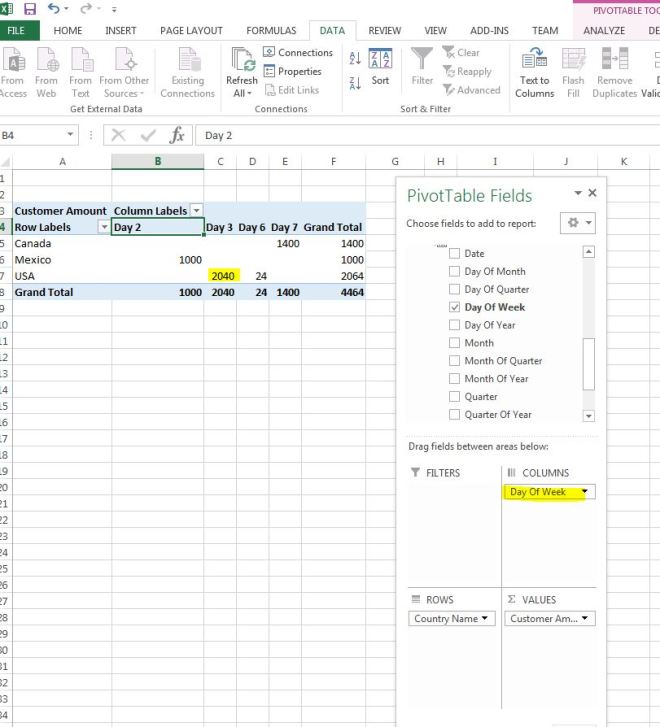
Finally we want to see what Day of Week we sell the most. Our day of the week starts on Sunday day 1, so day 3, Tuesday reports the most sales.
What good is this? Using this data, managers can determine staffing levels for the different days of the week. They can see that minimum staff is needed on certain days, and full staff is needed on others. If we were tracking time of sale, we could also calculate what times were busiest, and schedule staff accordingly based on historical data.
This was another long posting, but there is so much you can do with SSAS Cubes. Feel free to play with these examples and try out all of the possibilities.
