
In previous postings we have created a data warehouse, created a SSAS cube, now we are going to write a report using SQL Server Reporting Services to create a report against the cube data that we created.
In our example we are going to use the wizard. The wizard will probably be your biggest helper for 80-90% of the reports that you create, so it is very advantageous to use it.
First open up SQL Server Data Tools or Visual Studio and create a new project like below.
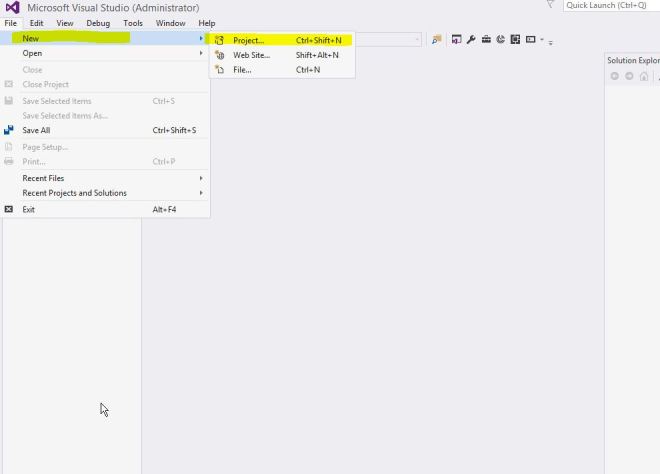
Under templates, choose Reporting Services and in the middle section, choose Report Server Project Wizard. At the bottom give your project a name, I named mine: CubeReport, then click OK.

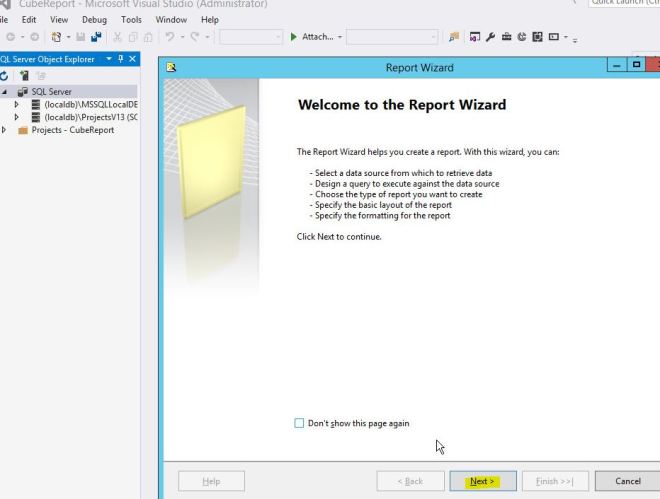
This brings up the wizard start screen, click next to start the wizard.
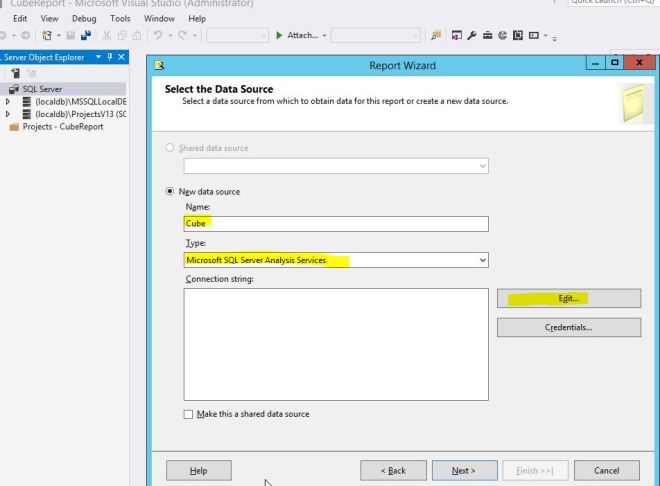
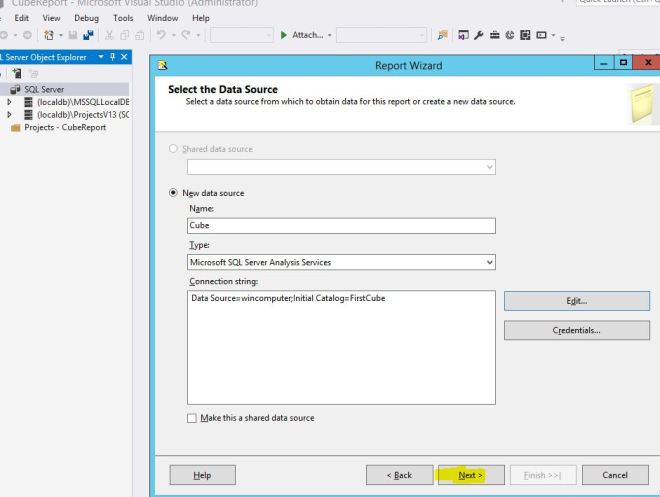
The first thing we need to do is create a data source. I am going to name mine Cube and in the drop down for type I am going to choose Microsoft SQL Server Analysis Services. There are many different types you can select see screenshot below. Press Edit.
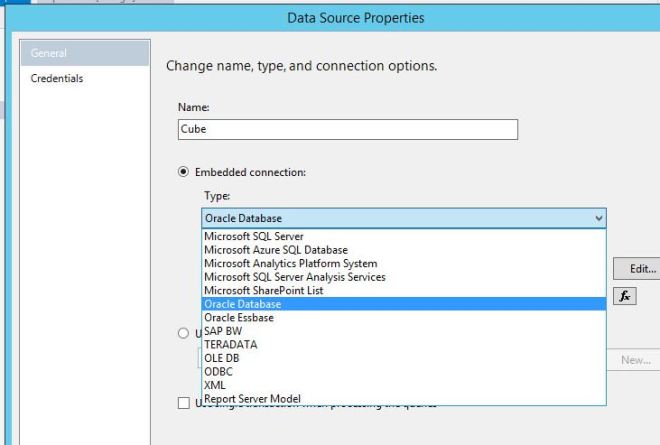
Below are the types of connections that can be made, almost all of the Microsoft data products, Oracle, Teradata, and if all else fails; ODBC.
Now you need to provide the server name that the Analysis Server is housed on. Ours is called Wincomputer and then select the name of the database you want to connect to, I am picking FirstCube. Press Ok when done.

That completes the data source setup, press Next to continue.
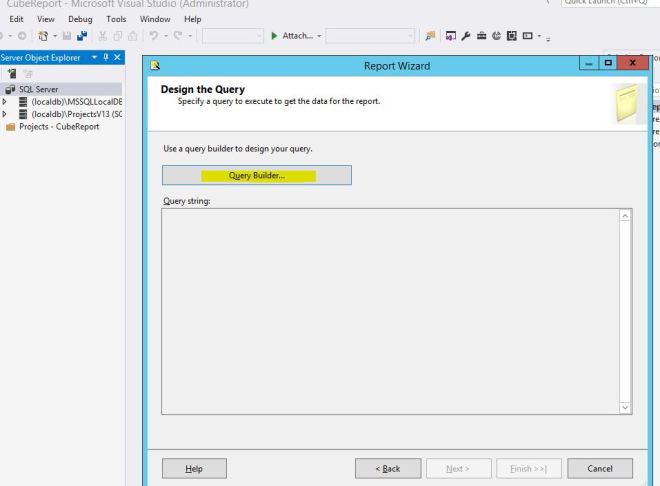
Now we need to create our query to pull the data. Press the Query Builder button and that will pop up a screen similar to the Browser that we used when we created our Cube.
Just like when we created our cube and went to the Browser tab.
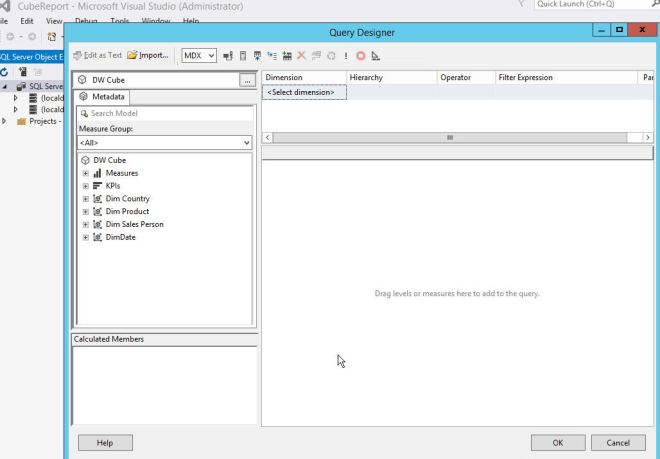
Like before, we just need to drag and drop the items that we want to include. First we drag the Customer Amount over.
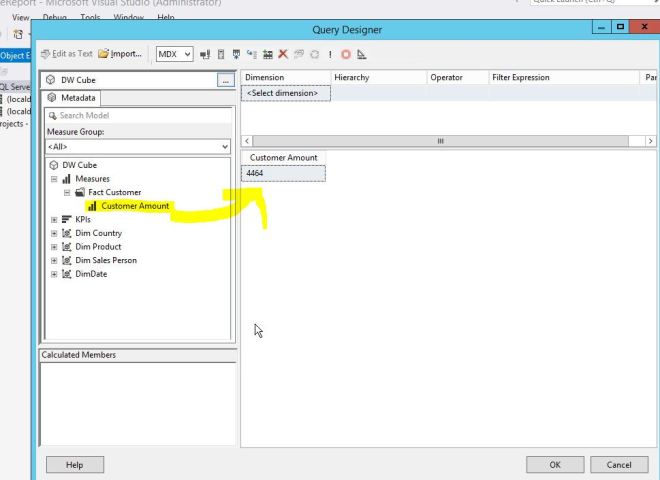
Then we drop over the rest of the fields that we need. When done press the OK button.
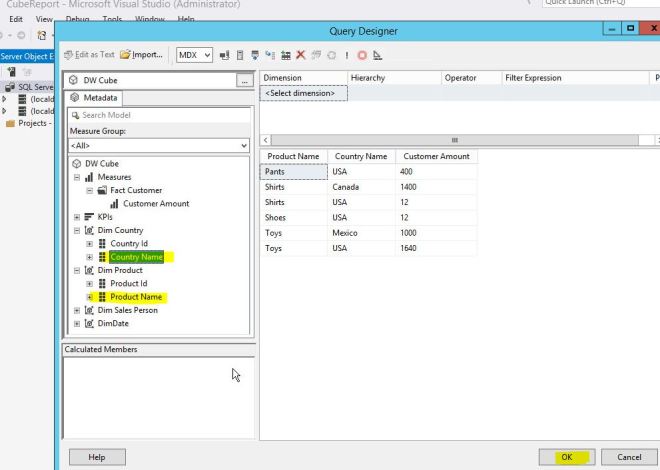
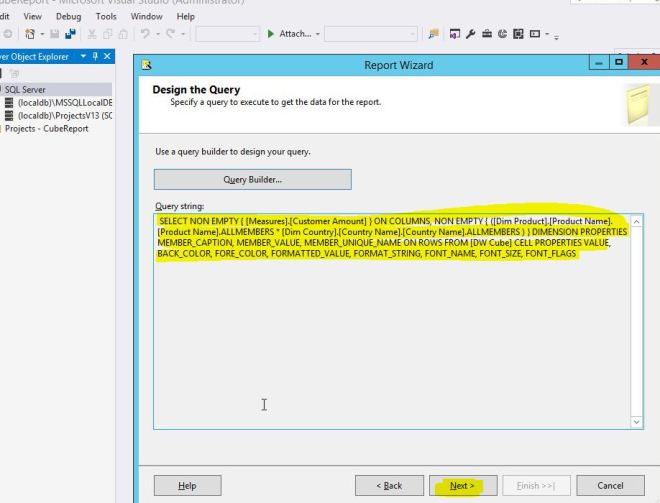
That completes our query writing, click Next when ready. If you look carefully at the query string, it looks similar to a standard SQL statement, but it is a special language called Multidimensional Expressions (MDX). There is plenty of information if you want to learn about this language by following this link.
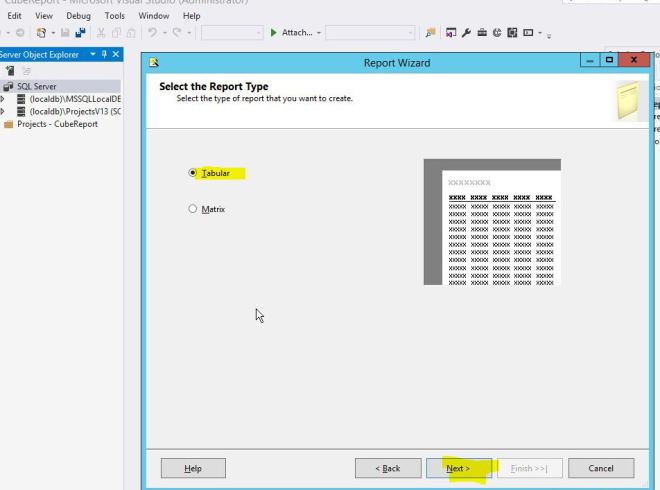
This continues the wizard and we need to select what type of report we want to create. We are going to create a Tabular report, so select it and press Next.
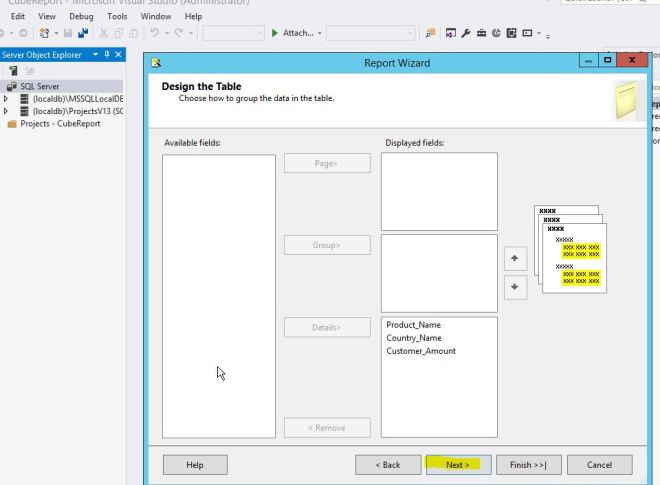
Since we are pulling from a Cube, we just want to add the fields to the Details section of the report. You do that by selecting the field from the Available Fields column and then clicking the Details button. Do that for each field.
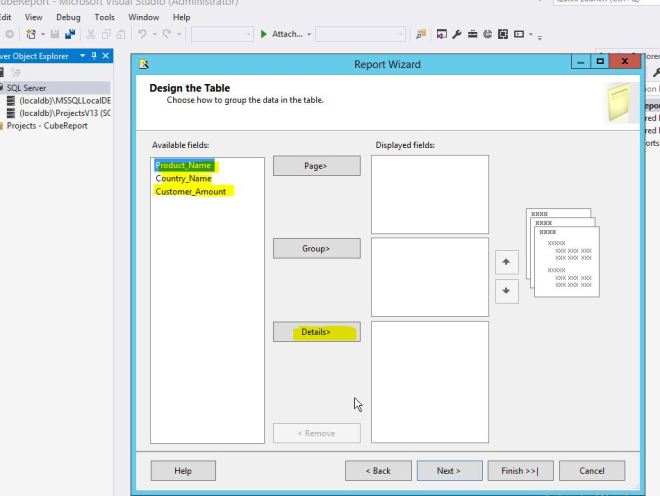
When that is complete, press Next.
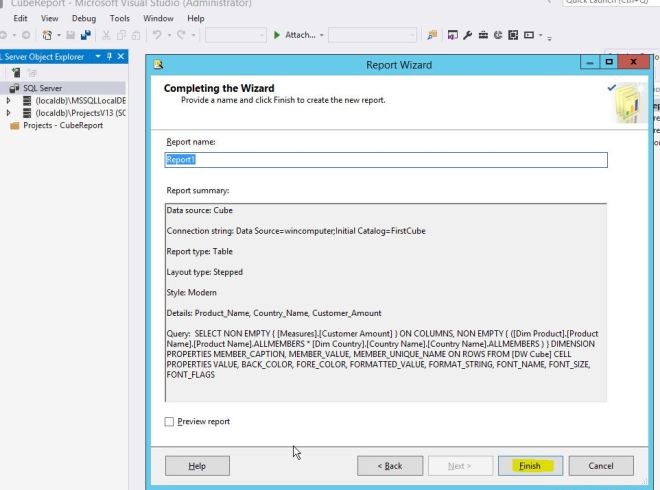
That takes us to the final step in the wizard, press Finish.
That takes us to the Design tab of our report. To preview our report, click the Preview tab next to the Design tab in the middle.
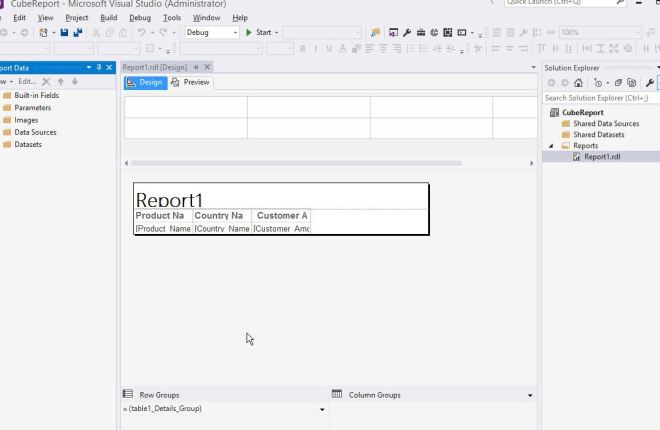
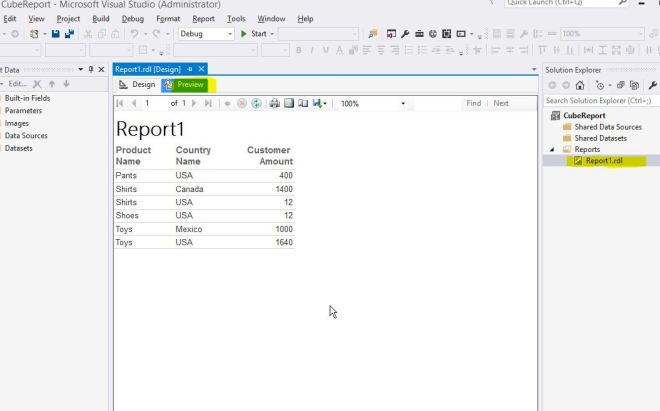
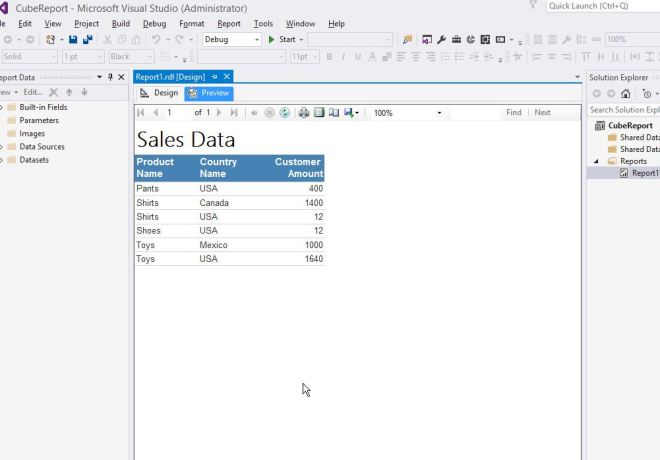
After clicking the Preview tab you will see your first report! It looks ok, but lets make some formatting changes to make it look better.
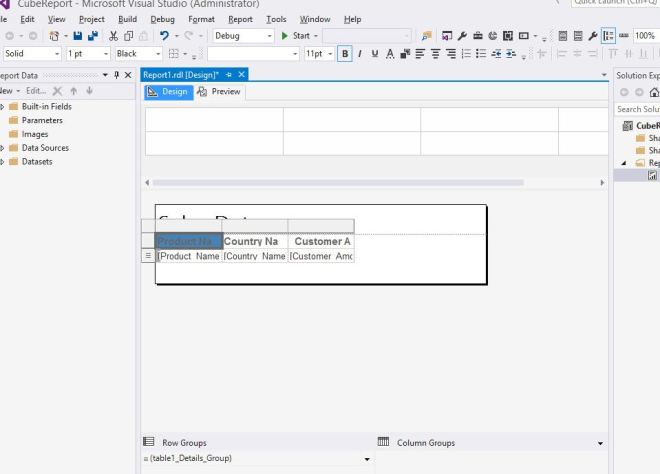
Click the Design tab again and then single click where it said Report1. Change it to read Sales Data like below.
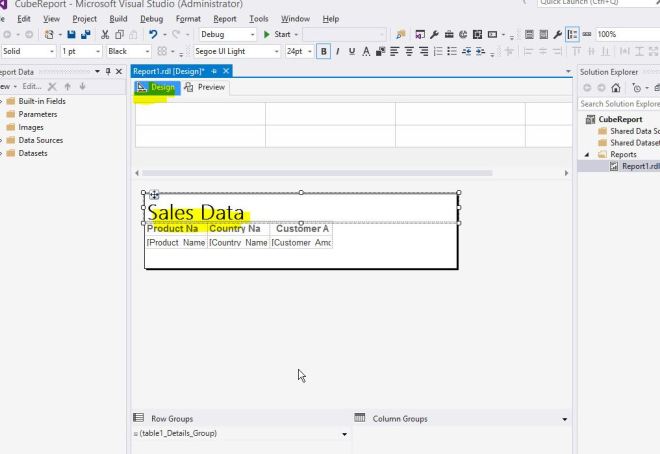
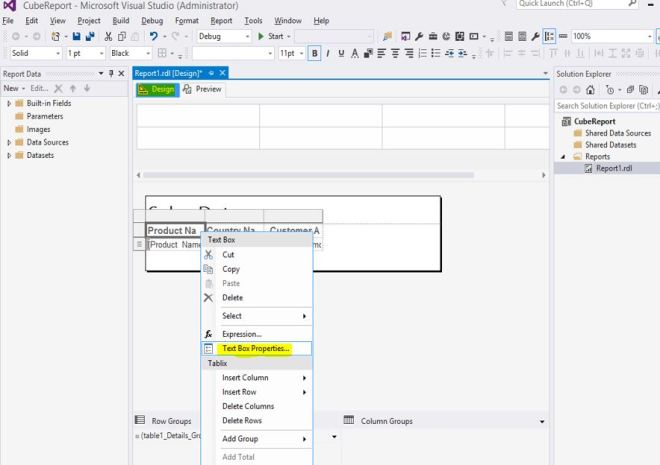
Now lets add some color to our column headings. Right click the Product Name column heading and pick Text Box Properties (highlighted below).
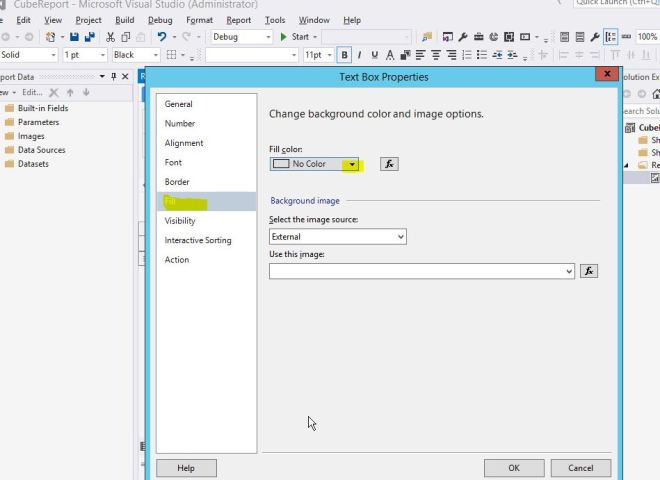
That brings up the text box properties screen. If you have ever used Excel, this is like formatting a cell. I selected the Fill option on the left and will change the fill color of the cell by selecting the drop down that currently is set to No Color.
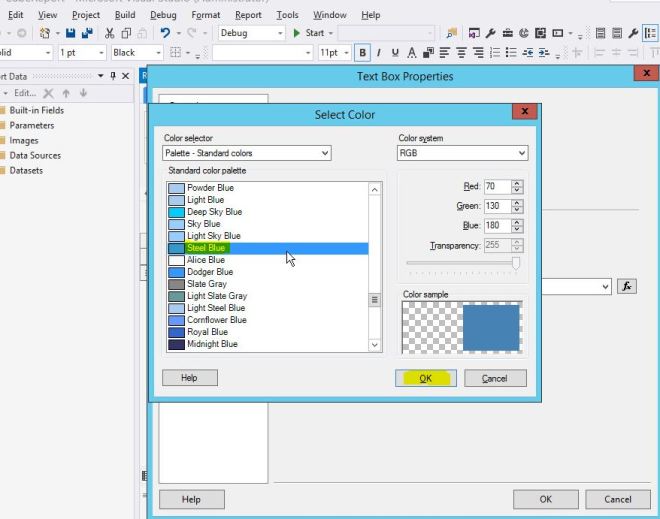
I like Steel Blue, so select that and press OK.
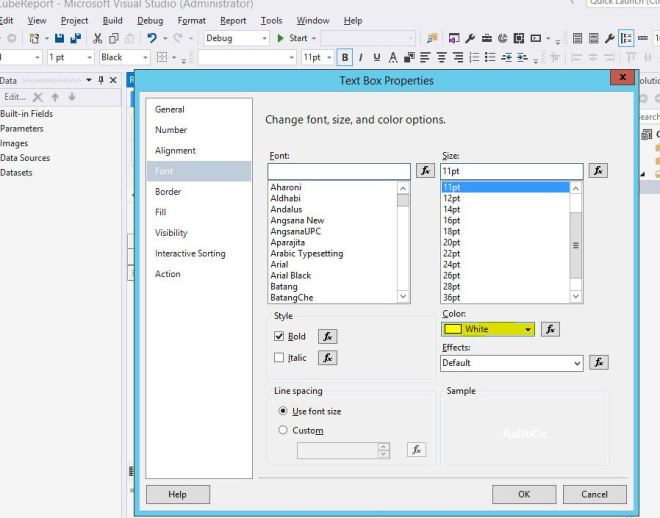
That made our column heading blue, but now we cannot read the text. Right click the column heading again and go to Text Box Properties again.
This time pick the Font choice on the left side and then pick White for the color as seen below. You can make many different changes to the font on this screen. When done, press Ok.
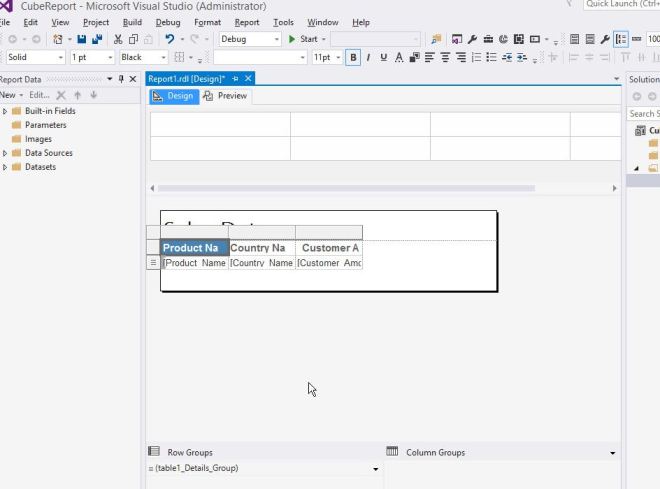
Now we can read the column name. Make the same color and font changes to the other two columns.
Clicking the Preview tab shows the changes that we made and makes the report easier to read.
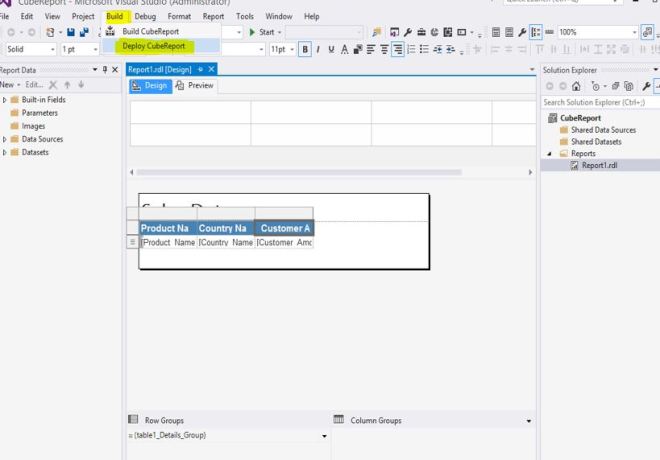
Now that the report is done, we need to deploy it to the SQL Server Reporting Services server, so users can use the report. We need to go to Build on the top menu and select Deploy CubeReport or whatever name you called your report.
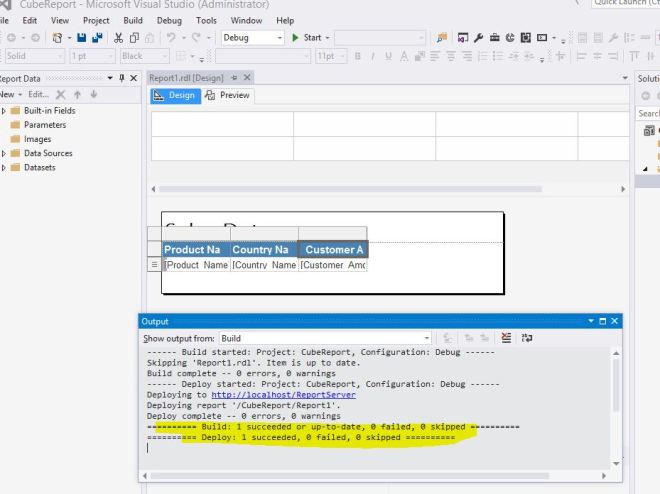
If we look at the output, there were no errors and the report was successfully deployed. This example assumes you have already installed SSRS and IIS on your server. If you do not have that done, then the examples below will not work for you.
Opening up your web browser, we can browse to http://localhost/ReportServer to run the report. Select CubeReport.
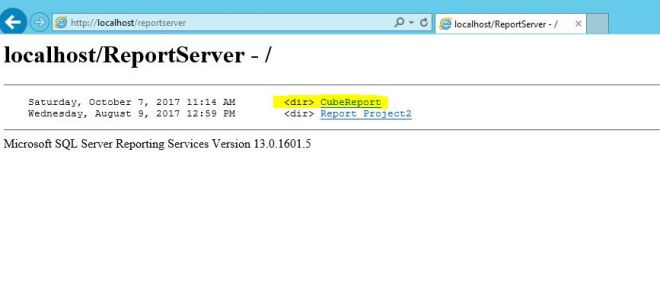 Then click Report1 to run the actual report. It is named Report1 because we did not change the default name in Visual Studio.
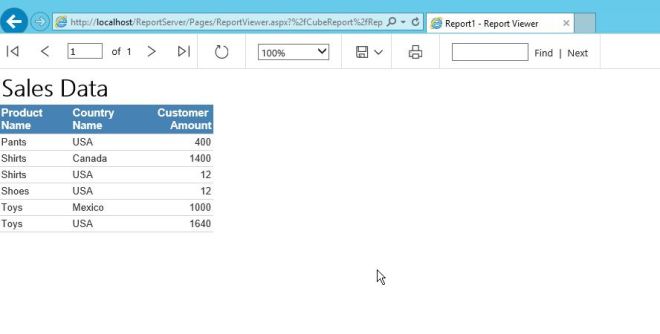
Yayyy….it worked. Now you can provide the link to users or publish the link to SharePoint, etc.
There are still some items that we can add to make the report more useful. Next posting we will be adding a drop down so we can parameterize the report.
Happy Reporting!
