
Today we are going to create a very simple SSAS cube to show some of the useful things that you can do with Sql Server Analysis Services. In production or a real world scenario, you would do much more planning and analysis, but this article will show you the steps that you will need to complete. This is really the tip of the iceberg of things that you can accomplish with SSAS, so feel free to explore.
This article has some assumptions: you already have a data warehouse created, and you know what a Star/Snowflake schema is. Below is a link that explains what a star schema is.
https://en.wikipedia.org/wiki/Star_schema
Here we go!
Below is a listing of our database tables that we will be using for our cube. This is a simple Star Schema design that would be populated with your nightly ETL loads. We have 3 dimensions, DimCountry, DimProduct, DimSalesPerson. We also have 1 fact table called FactCustomer. Below shows the contents of the tables.

Now, first open up Sql Server Data Tools or Visual Studio and create a new project. Click on Business Intelligence on the left, then highlight Analysis Services and then choose “Analysis Services Multidimensional and data mining.” I am naming my project “FirstCube”, then press OK.

This will bring up a blank canvas, with the Solution Explorer on the right side. To build our cube, we will start at the top and work our way down. First we will create a Data Source.

Right click on Data Source and click new data source. That will start the data source wizard.
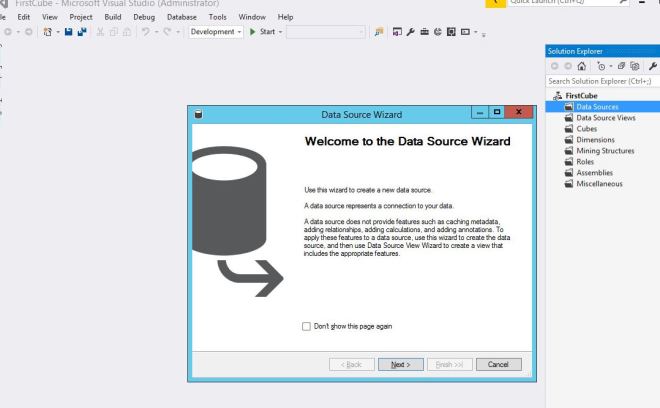
Choose create a data source based on an existing or new connection and then press New.
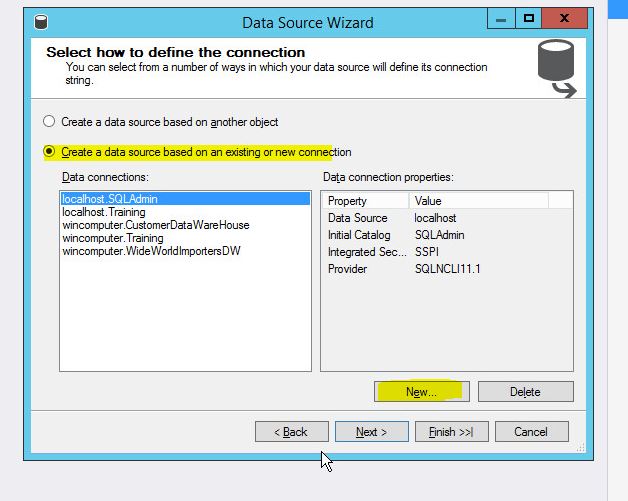
This screen should look familiar, you need to provide your server name, authentication method, and database name you want to connect to and click OK.

Then we need to specify a username and password that SSAS will use to connect.

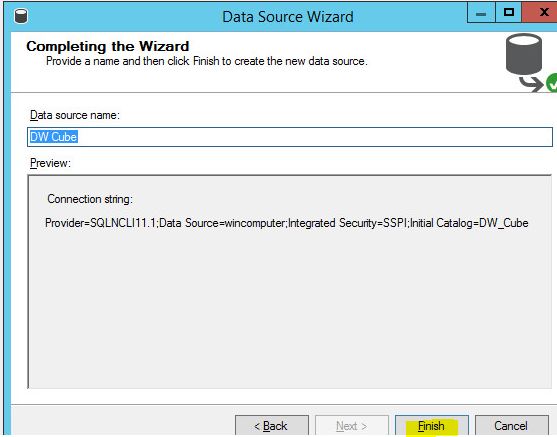
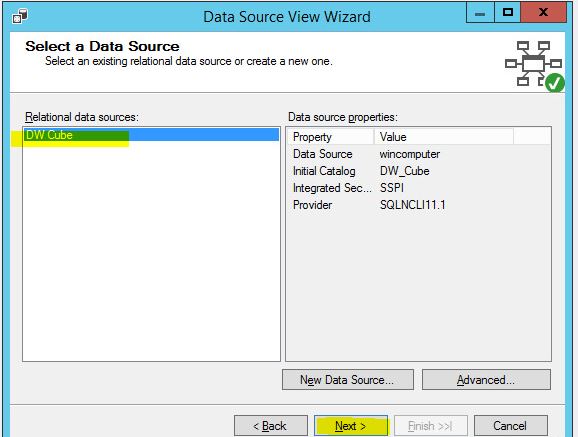
That takes us to the final step of the wizard and you press finish. Ours will be named DW_Cube.
First item is done. Now we need to create a Data Source View, so right click the item on the right and select New datasource view. That opens up the wizard below.
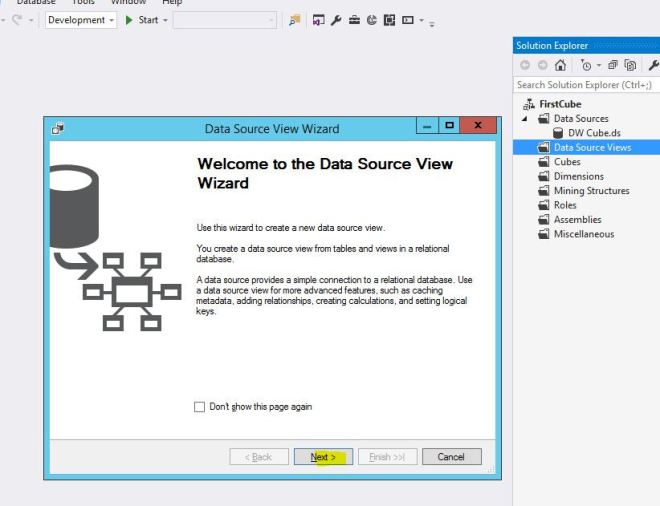
We need to select the source connection we just created and then click next.
We now need to select the tables that we will be using from our database. We will choose our three dimensions and one fact table.

Then press Next.

We will name our data source view DW_Cube to stay consistent and then press Finish.

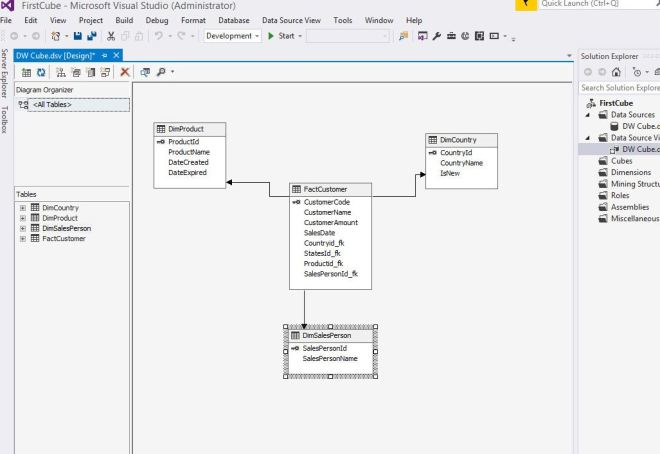
That will add the tables to the blank canvas that we started with. You can see the DimSalesPerson is linked to the FactCustomer table already because the database tables had foreign key relationships created at the database level. We will need to link the FactCustomer table to the DimProduct and DimCountry since those relationships were not created on the database.

You do that by clicking on the Product_fk field in the FactCustomer table below and drag it to the ProductId field in the DimProduct table. After you link the other table, it will look like below. My star is lopsided because I did not add all of the tables, but this still works.
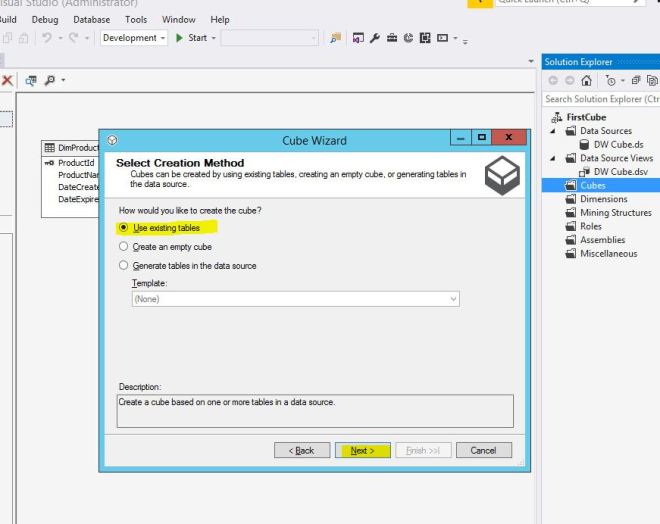
Now we need to go to the next item which is Cube. Right click on Cubes and create new cube to start the wizard below.

Now it is asking us how we want to create the cube, we need to select Use Existing Tables for our example.
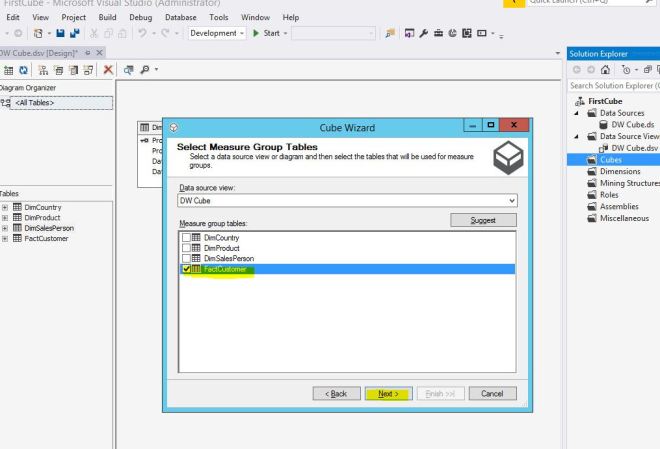
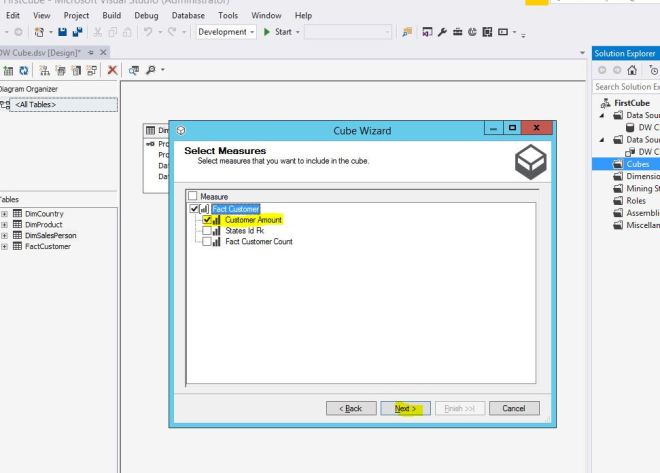
The next option is asking for the Measure Group Table. A measure group and a fact table are the same thing (remember that forever), so select FactCustomer and click Next.
Then we have to choose what field we want from the table. Currently we only care about the Customer Amount.
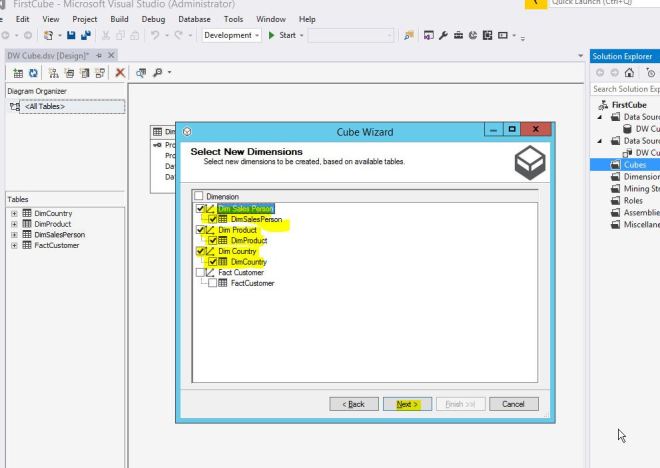
Now we need to provide the dimensions. Choose the DimSalesPerson, DimProduct, and DimCountry tables.
We want to name our cube DW_Cube and then click finish.
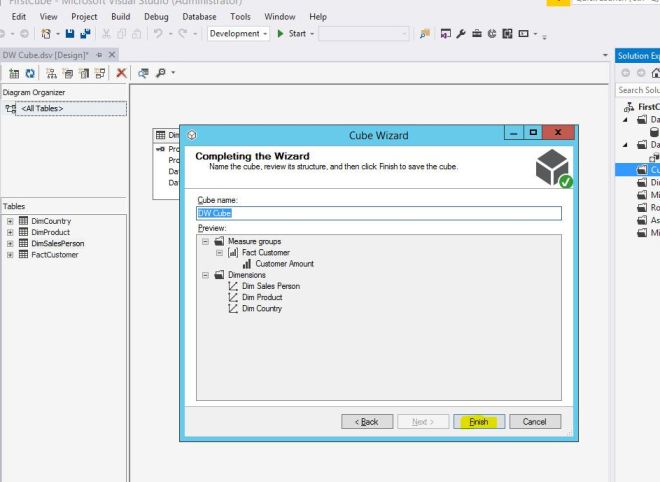
That adds a cube under the Cubes section of Solution Explorer.

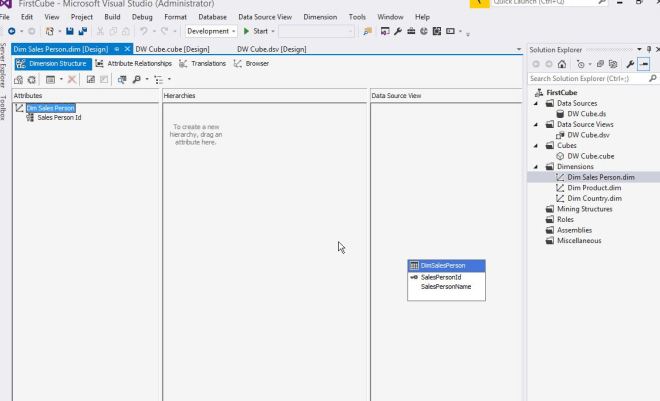
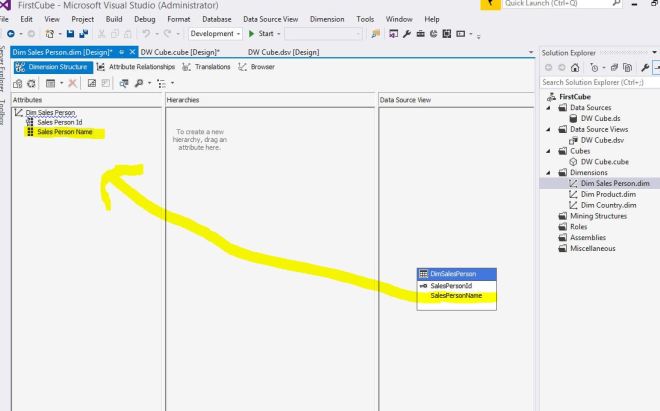
Now we need to do some fine tuning to our dimensions, so under Solution Explorer, double click DimSalesPerson.dim under Dimensions. This opens up the screen below. In the first column, Attributes, it only has the SalesPersonId. In the third column, Data Source View, we want to add the SalesPersonName to the Attributes column. All we need to do is click the SalesPersonName, and drag it over to the Attributes column.
Then close the tab and it asks you if you want to save, click the save button.

Now you need to do it for the other two dimensions. Copy over the ProductName and CountryName to their respective Attributes.
After all of that is done, we can finally process our cube. Right click DW_Cube under Cubes in Solution Explorer and click Process.

It will prompt you with this message, click Yes.

That brings up the process cube options screen. For our example we do not need to modify any settings, so click Run at the bottom.
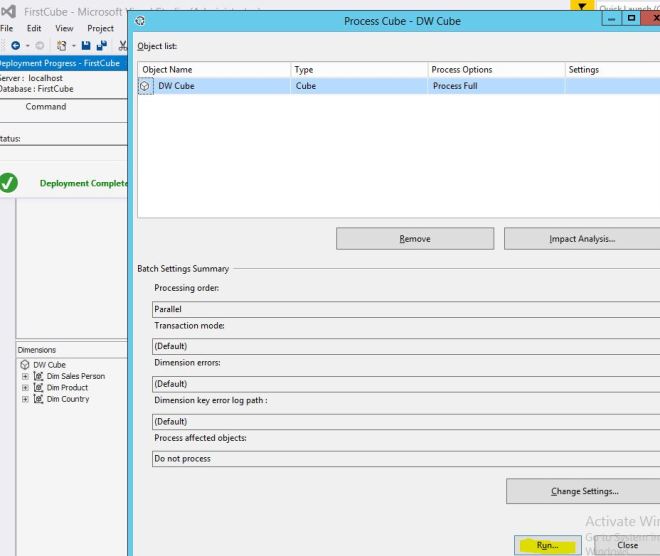
If all goes well, you will get the Process Succeeded message like below. Click close to finish.

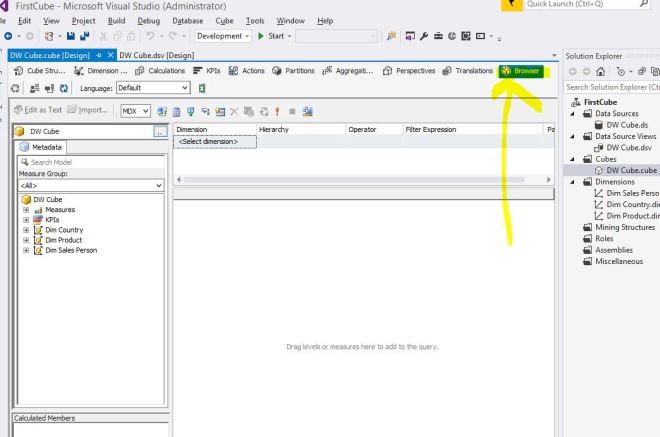
Once the Cube is created and processed, it will bring up a screen like below. The end users will not have access to this screen as it is just for development, but this gives us the ability to check our cube out. On the right side there is a tab called Browser, click it.
On the left side, click measures and then drill down to the FactCustomer and drag over to the center screen, CustomerAmount. That puts in the amount 4464.

Now open the DimCountry, DimProduct, DimSalesPerson tabs and drag over the CountryName, ProductName, and SalesPersonName. It should populate like below. Now you can see why we modified our dimensions to include the names instead of just using the ID’s. You can experiment by adding or subtracting different dimensions to see how it slices and dices.

Whew, you just created your first cube. There are plenty of additions and modifications we can make such as adding the sales date to the FactCustomer and adding a Date table so you can break things down by month, quarter, year, etc. There are also Calculations you can create that are similar to Excel calculations.
In the next article, I will show you how to connect to the cube using Excel and how the end users would interact with your new cube.
